This is part 2 of a series of posts that show how we can model virtual kanban systems on TFS 201x.
If you didn’t read part 1, I would recommend that you start there.
Big gotcha with regard to this blog post
You cannot access the TFS data warehouse (which we will need to do) using Visual Studio Online and as far as I know, there is no way to access the data stored there in any way yet. As such, this post will make the assumption that you are using TFS 201x on-premise and can access the TFS Data Warehouse.
Assumptions
Same assumptions from part 1 apply and I’ll re-iterate them here along with a few other assumptions.
- You are a TFS user and will understand the features that I’m using.
- You have a basic understanding of TFS Process Templates
- You have a basic understanding of the Iteration Path hierarchical work item field that is present in the various Process Templates
- A basic understanding of virtual kanban systems as they pertain to software development
- NEW – You have a basic understand of how TFS Work Item States work
- NEW – You have a working knowledge of Excel 2010+
- We’ll be connecting to databases and programming in VBA
Quick Review
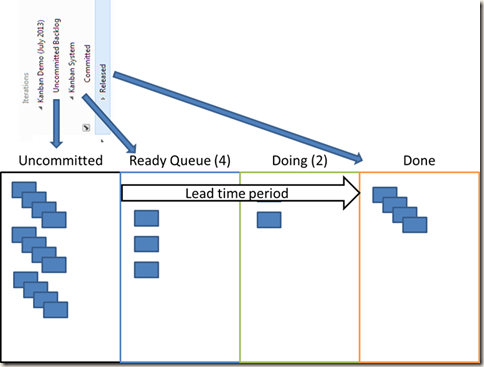
Just as a quick review, here is the current state of our virtual kanban system implementation.
Remember that we are using iteration paths to represent the backlog (uncommitted work) and the kanban system and the only work item state we will be (really) interested in is “Done”.
Calculating Basic Lead Time Metrics
Using the movement of a work item into the kanban system iteration path, until it gets to a “Done” state, we can now calculate the lead time for that item. The easiest way I’ve seen to do these analysis, after your kanban system has been setup and running for a while, is to use Excel to consume and analyze TFS data warehouse data about work item changes.
Developer Ribbon in Excel
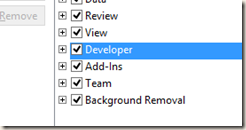
The first thing we need to do is turn on the Developer Ribbon in Excel. After you’ve started Excel (I’m using 2013), right click on the ribbon and select the Customize the Ribbon option.
Turn on the Developer tab by checking the box and pressing OK.
Prepping the Spreadsheet
For this exercise, I like to create three sheets in my Excel workbook.
- Parameters
- LeadTimeReport
- Data
We will refer to the names of these sheets in our Excel VBA code.
Getting Data From TFS
Excel has the functionality to connect to easily connect to SQL Server databases and that is exactly where TFS stores all of it’s data. TFS stores the data that we are interested in in a database that is called Tfs_Warehouse.
Navigate to the Data tab on your spreadsheet and put the caret on cell A1.
Now create a connection to Tfs_Warehouse by visiting the Data tab, clicking the From Other Sources button and selecting From SQL Server.
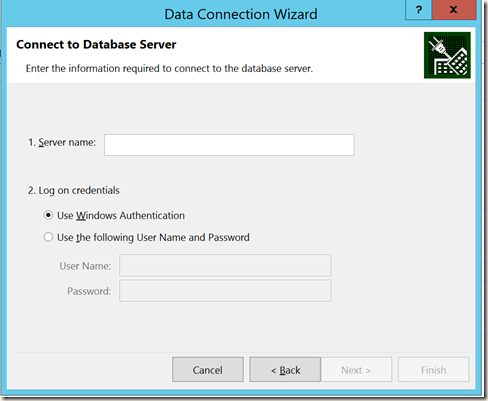
Enter the name of the database server that is the backend for your TFS installation and use the appropriate credentials (SSO or SQL Server account) in the connection dialog and click Next.
Note – You will need to able to access the server with either your domain account permissions or a SQL Server account that has permissions to access Tfs_Warehouse database.
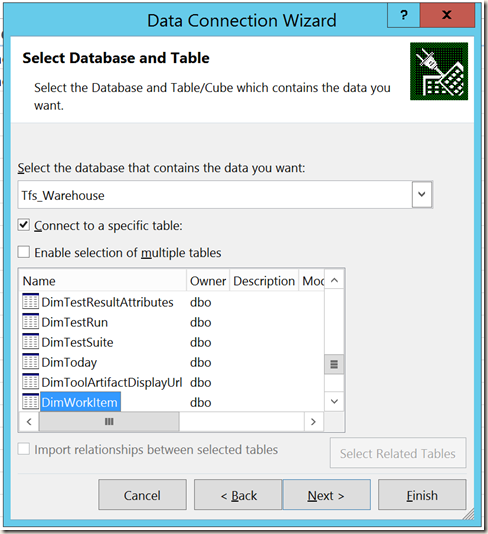
Select the Tfs_Warehouse database on the server and the DimWorkItem table and click Next.
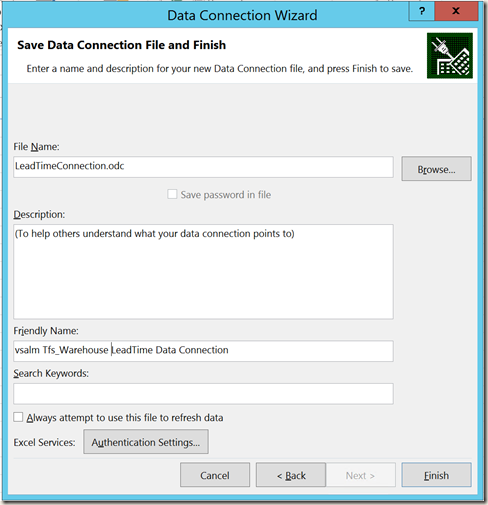
Change the name of the connection to something more friendly like LeadTimeConnection.odc and set the friendly name to something more descriptive and click Finish.
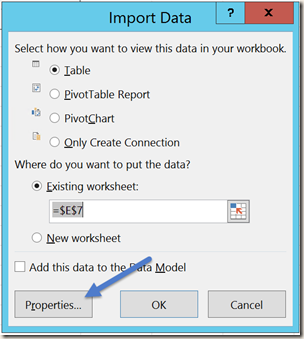
An Import Dialog will pop open once you have hit Finish. Select the Properties button on this dialog.
On the Properties dialog, click the Definition tab and then change the Command Type to SQL and enter the SQL statement below in the Command Text textbox and press OK.
SELECT system_id, system_title, system_state, di.iterationpath, system_changeddate, System_WorkItemType
FROM dimworkitem dw
INNER JOIN dimiteration di
ON dw.iterationsk = di.iterationsk
Now press OK on the Import dialog and you should now see the Data sheet fill up with data from your TFS database.
VBA Magic to the Rescue
Now that we have our work item data coming, we need to do a couple things:
- Narrow it down to the time period under review
- Determine what started and finished within that time period
- Calculate the Lead Time for the items that completed during this period
Caveat – I’m not a VBA Script writer by trade! I’m fairly certain there could be better ways to write this code, but since writing elegant VBA code is not my objective, I’ll just get you to the lead times. If you have any suggestions on how to better code this out, I’d love to hear from you.
Create a VBA Module
On the Developer tab, click the Visual Basic button to get to the VBA IDE.
Once you are in the Visual Basic editor, create a new module for holding your code by right-clicking on the Module node of the tree and inserting a new Module.
Now we can just start entering all of the code from below.
Declare String Constants in the Module
Public paramSheet As String
Public reportSheet As String
Public dataSheet As String
Public connectionName As String
Public backlogIterationPath As String
Public kanbanSystemIterationPath As String
Public startState As String
Public endState As String
These strings (global) allow us to do set our sheet names and change the iteration paths that we use to model our kanban system.
Determine Vertical Range of Data
Private Function VerticalRange()

Sheets(dataSheet).Activate
Range("B1").Select

Dim height As Integer
height = 0

Do While ActiveCell.Value <> ""
    height = height + 1
    ActiveCell.Offset(1, 0).Activate
Loop
VerticalRange = height

End Function
Private Function VerticalRange() Sheets(dataSheet).Activate Range("B1").Select Dim height As Integer height = 0 Do While ActiveCell.Value <> "" height = height + 1 ActiveCell.Offset(1, 0).Activate Loop VerticalRange = height End Function
This code needs to discover the length of the data set that we’re processing. This function does that.
Create Lead Time Generation Function
Private Sub GetLeadTime(ByVal rows)

Dim sourceRowCount As Integer
Dim targetRowCount As Integer
targetRowCount = 2

Dim sws As Worksheet
Dim tws As Worksheet
Set sws = ThisWorkbook.Sheets(dataSheet)
Set tws = ThisWorkbook.Sheets(reportSheet)

Dim workitemid, firstRow, lastRow, nextFirstRow As Integer
firstRow = 2

For sourceRowCount = 3 To rows
     workitemid = sws.Range("A" + CStr(firstRow)).Value
     Dim wiD As String
     wiD = sws.Range("A" + CStr(sourceRowCount)).Value

     If wiD = workitemid Then
        'skip if true – we are looking for the last row for the current work item
     Else
        lastRow = sourceRowCount - 1
        nextFirstRow = sourceRowCount

        Dim isUncommittedBacklog, isKanbanSystemBacklog, isUncommittedNew, isKanbanSystemNew, isDone As Boolean
        Dim uncommittedBacklog, kanbanSystemBacklog As String
        Dim uncommittedBacklogFound, kanbanSystemBacklogFound As Boolean
        Dim startDate, endDate As String

        For rowNum = firstRow To lastRow
            isUncommittedBacklog = InStr(1, sws.Range("D" + CStr(rowNum)).Value, backlogIterationPath, vbTextCompare) > 0
                If isUncommittedBacklog = True Then
                    isUncommittedNew = InStr(1, sws.Range("C" + CStr(rowNum)).Value, startState, vbTextCompare) > 0

                    If isUncommittedNew = True Then
                       uncommittedBacklogFound = True
                    End If
                End If

            isKanbanSystemBacklog = InStr(1, sws.Range("D" + CStr(rowNum)).Value, kanbanSystemIterationPath, vbTextCompare) > 0

            If isKanbanSystemBacklog = True And uncommittedBacklogFound = True Then
                isKanbanSystemNew = InStr(1, sws.Range("C" + CStr(rowNum)).Value, startState, vbTextCompare) > 0

                If isKanbanSystemNew = True Then
                   kanbanSystemBacklogFound = True
                   startDate = sws.Range("E" + CStr(rowNum)).Value
                End If
            End If

            If kanbanSystemBacklogFound = True And uncommittedBacklogFound = True Then
                isDone = InStr(1, sws.Range("C" + CStr(rowNum)).Value, endState, vbTextCompare) > 0
                If isDone = True Then
                    endDate = sws.Range("E" + CStr(rowNum)).Value
                End If
            End If
        Next rowNum

        'Calculate Lead Time
        If IsDate(startDate) And IsDate(endDate) Then
            Dim leadTime As Integer
            leadTime = DateDiff("D", startDate, endDate)
            tws.Range("A" + CStr(targetRowCount)).Value = sws.Range("A" + CStr(lastRow)).Value
            tws.Range("B" + CStr(targetRowCount)).Value = sws.Range("B" + CStr(lastRow)).Value
            tws.Range("C" + CStr(targetRowCount)).Value = leadTime
            targetRowCount = targetRowCount + 1
            startDate = ""
            endDate = ""
        End If

        firstRow = nextFirstRow
        nextFirstRow = 0
    End If
Next sourceRowCount

End Sub
This code is pretty messy but isn’t actually very complicated. What happens in this function is that we go through each row of the source data set and look for the work item entering the kanban system iteration path. We then look for the work item getting to the done state.
If a Start Date and and End Date are discovered for the work item, we make an entry in the LeadTimeReport sheet with the calculated Lead Time. If we do not find those dates, no entry is made.
You can step through the code in the IDE using F8 to step through each line of the function.
Create Public Access and Initialization Function
Public Sub GenerateReport()

'constants in module
paramSheet = "Parameters"
reportSheet = "LeadTimeReport"
dataSheet = "Data"
connectionName = "LeadTimeConnection"
backlogIterationPath = "\Tailspin Toys\Iteration 1"
kanbanSystemIterationPath = "\Tailspin Toys\Iteration 1"
startState = "Active"
endState = "Closed"

Dim startPeriod, endPeriod As Date
startPeriod = ThisWorkbook.Sheets(paramSheet).startDatePicker.Value
endPeriod = ThisWorkbook.Sheets(paramSheet).endDatePicker.Value

Dim cmdText, periodDates As String
cmdText = ThisWorkbook.Connections(connectionName).OLEDBConnection.CommandText
periodDates = " Where system_changeddate between '" + CStr(startPeriod) + "' and '" + CStr(endPeriod) + "' and System_WorkItemType = 'User Story' Order by system_id , system_changedDate asc"

Dim location As Integer
location = InStr(1, cmdText, "where", vbTextCompare)

If location > 0 Then
    cmdText = Left(cmdText, location - 1)
End If

ThisWorkbook.Connections(connectionName).OLEDBConnection.CommandText = cmdText + periodDates
ThisWorkbook.Connections(connectionName).Refresh

Call GetLeadTime(VerticalRange)

End Sub
Public Sub GenerateReport() 'constants in module paramSheet = "Parameters" reportSheet = "LeadTimeReport" dataSheet = "Data" connectionName = "LeadTimeConnection" backlogIterationPath = "\Tailspin Toys\Iteration 1" kanbanSystemIterationPath = "\Tailspin Toys\Iteration 1" startState = "Active" endState = "Closed" Dim startPeriod, endPeriod As Date startPeriod = ThisWorkbook.Sheets(paramSheet).startDatePicker.Value endPeriod = ThisWorkbook.Sheets(paramSheet).endDatePicker.Value Dim cmdText, periodDates As String cmdText = ThisWorkbook.Connections(connectionName).OLEDBConnection.CommandText periodDates = " Where system_changeddate between '" + CStr(startPeriod) + "' and '" + CStr(endPeriod) + "' and System_WorkItemType = 'User Story' Order by system_id , system_changedDate asc" Dim location As Integer location = InStr(1, cmdText, "where", vbTextCompare) If location > 0 Then cmdText = Left(cmdText, location - 1) End If ThisWorkbook.Connections(connectionName).OLEDBConnection.CommandText = cmdText + periodDates ThisWorkbook.Connections(connectionName).Refresh Call GetLeadTime(VerticalRange) End Sub
This code is the function that is going to be invoked by the button we put on our parameters sheet. It sets all of the global values for the module, acquires the start and end date of the period under observation, modifies the command text of the SQL query to use the dates in the query,
Create UI
Now that the module has been created that does all of the data transformation work, we need a simple UI that allows us to pick a Start Date and an End Date for the period under observation and a button to kick the whole thing off.
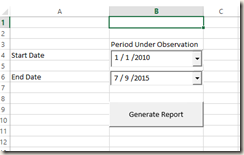
After you have selected the Parameters worksheet, in cell A4 type out “Start Date”. In cell A6 type out “End Date”. And finally on B3 put “Period under Observation”. These are labels for our UI.
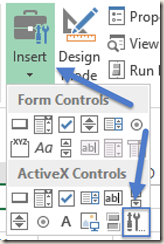
Now on the Developer tab, click the Design Mode icon on the ribbon. Now we can Insert 2 Date Picker controls onto the worksheet. Click the Insert icon on the ribbon and then click the the very last icon on the bottom right.
In the More Controls dialog that comes up, select the Microsoft Date and Time Picker Control 6.0 (SP4) and then click OK. You will now be able to “draw” out the new control on the worksheet. Draw out the first control roughly on cell B4. In the Excel Name Box, name the control startDatePicker.
Repeat the process for the second date time control and draw the second control roughly out on B6. In the Excel Name Box, name the control endDatePicker. These names are used in the script to find the range parameters.
Now we need to add a button. Click the Insert icon again and select the first icon on the top left and draw out a button roughly on cell Here is what it should look like when complete.
Generating Lead Time Data
We should have completed all of the steps required to generate lead time data for the kanban system that we’ve model in Part 1 of this series of blog posts!
If you press the buttons and everything has been typed in correctly, you should see data populate the LeadTimeReport worksheet. This will look roughly like this.
You can format the first row of the LeadTimeReport sheet however you see fit. If you want to add more rows of labels, you will need to edit the scripts as they start adding lead time entries on row 2.
I’d like to point out that in this case, I’m using the Brian Keller ALM VM for Visual Studio 2013.4 and the Fabrikam Team Project inside of that VM for data. You will need to change the script to reflect the iteration paths that you are using your kanban system in TFS.
Final Thoughts
This has been a fairly long and detailed post and I hope that you’ve been able to follow it and get the lead time data generation working in your environment.
There are more sophisticated ways of generating this lead time data (programmatically more advanced applications). The reason I wanted to use Excel and Visual Basic was to allow anyone to generate lead time data with the basic tools that are available in a normal IT shop that uses TFS. If you’d like to expand on this approach and develop an application that does this (which I have already done elsewhere), I hope that you can use this example as a guide to what you’ll need to do to write your application.
Thanks and I hope to hear from you in the comments soon. Let me know if this worked for you or how I can make this example better.

