Home » Kanban (Page 2)
Category Archives: Kanban
The Difference Between The Kanban Method and Scrum
A question that I often get while speaking with people is:
What is the difference between Kanban and Scrum?
I know this topic has been explored at length in many places on the internet and also with a variety of different answers, but I’m going to put my thoughts down and share them with you because:
- I still feel there is a lot of misunderstanding on this topic and I think I have something to add to the conversation
- People still ask. The more of us who can blog and promote conversation on the topic, the better.
- Getting my thoughts out and in a more concrete form that I can reference (and send people to reference) should promote better conversations as well.
So. Here it is. Kanban Method. Scrum. I imagine I’m about to step on some toes but I hope we can have some good debates and not conversations filled up with rhetoric.
Similarities
Goals
At their hearts, both methodologies are attempting to do the same thing. They are attempting to advance the state of the art in work management predominately (but not only) in the area of knowledge work.
Value-system Influences
Both are heavily influenced by value-systems. Scrum is primarily influenced by the Agile Manifesto which describes the “Agile” value system. The Kanban Method pulls a great deal of its values from a Lean value system. There isn’t really a “Lean Manifesto” but the works of Taiichi Ono and W. Edward Deming contribute to a common understanding of what it means to be a lean thinker. They are not the only contributors but have made the most significant impressions on the Lean/Kanban community. The Kanban Method is also influenced by the Agile Manifesto and the values inherent within it.
Increments
Both methodologies believe in delivering software incrementally to maximize the opportunity to get feedback and capture ROI. Incremental delivery of software also mitigates risk and maximizes the opportunity to learn from a business, process, and technical perspective.
People-centric
Both methodologies are striving to make people a central aspect of the system, which they should be. 😀 Scrum strives to “protect” the development team from the influences of “traditional” project management tactics. Kanban suggests that we need to allow solutions to problems emerge from the people in the system. Kanban also believes that changes should not be forced on people, but that people need to own the changes and be supported throughout the transition. Both systems try to give people the time and space required to improve.
Similarities with Significant Differences
Learning
Both approaches promote an intent to learn and improve. In Scrum this is primarily achieved through the retrospective tactic which is an Inspect and Adapt-based tactic. The team will get together (frequently) to discuss processes and tactics that have been going well and should be continued, things that haven’t gone well and should be changed for the next sprint. I do not believe that Scrum teams put sufficient emphasis on this aspect of Scrum and that the common understanding of Scrum doesn’t promote this aspect strongly enough. I also believe that the scope of the area under review primarily focused on the team. Again, this may not be the intent but it is, in my experience, the way it is implemented.
The Kanban Method has learning at the core of the methodology. There are several reasons for this, but the primary reasons for this are:
- Do nothing without understanding the current situation
- The current situation is always changing
- New challenges (technical and business) are always arising
- People, who are at the heart of the system, need to be learning constantly in order to be improving themselves and the system continuously
- Without a learning approach to improvement, you can’t use experiments to test improvements
The Kanban Method uses more of a Plan – Do – Study – Adapt (PDSA) approach to learning and this is different from a Inspect and Adapt approach.
Cadences
Scrum prescribes a cadence and that all activities happen within that timebox. If you didn’t guess, this cadence is called the sprint duration. Sprint is just another name for the resulting timebox.
The typical Scrum cadence now a days seems to be 14 days (2 weeks) and follows the following sequence of:
Sprint Planning -> Execution (daily Scrum meetings) -> Iteration Review -> Retrospective -> repeat cycle
Scrum’s Sprint duration is a great innovation over the traditional approach to managing work. Because the guidance on duration has never been longer than 30 days, Scrum teams have always been guided to strive for shorter feedback cycles than traditional projects. Scrum teams have also been guided to produce increments of software at the same rate. In order for Scrum teams to do this, work has to be decomposed and understood by the development teams. Work gets prioritized more frequently and this prioritization allows these teams to be agile from a business perspective. Risk can also be explored and mitigated within the sprint and that knowledge feeds back into the prioritization loops of the team.
In the Kanban Method, cadences are just as important as they are in Scrum. Many Kanban teams have a Queue replenishment cadences. This is effectively the same as the Sprint Planning activity in Scrum. Many (most?) Kanban teams have a daily stand-up meeting where the team discusses the current state of the kanban system, looking to remove impediments and manage work at risk of taking longer to deliver than expected. Many Kanban teams will have product demos (iteration review) that coincide with an opportunity to deliver or deploy the product being built. And many Kanban teams will have Operations Reviews which are an opportunity to discuss the Kanban teams progress and improvements with the rest of the organization.
The significant difference between the two systems is Kanban does not typically use timeboxes and all of the cadences in a kanban system can happen when it is best for the organization to do them.
Timeboxes are a mechanic that Scrum uses to minimize disruption to the development team. In Scrum, changes to the Sprint plan are strongly discouraged. Plan the two weeks, then let the team work uninterrupted. This has allowed for great improvements in productivity in software development, but what if we could apply that protective attitude to a single piece of work. So while a team was working on an item, they were not disrupted but they could be counted on to pull the next highest priority item on the queue as soon as they were ready to pull some work. The business could prioritize as much as needed while the team had work in progress.
Timeboxes are also used to provide a consistent interval that external parties can interact with the Scrum team. Business can plan around a 2 week cadence to injecting new requirements into the system, and downstream partners (IT, Sales) can count on getting new work or increments of software every 2 weeks as well.
In Kanban, the cadences that are most appropriate for the external partners can be allowed to emerge and do not need to be enforced (or tied together) by the development team. There are advantages for shorter cadences, but what if we could get all the way down to Just In Time and we no longer had cadences on replenishment and delivery? We can still have cadences on Ops Reviews or any other ritual that benefits from these cadences. What if replenishment happened every week, or daily, and delivery happened every 4 weeks? Or on the 25th day of each month? That is an advantage that many organizations benefit from when adopting a kanban system as a way to manage work.
Pull-based , WIP Limiting Systems
Both Scrum and Kanban ARE Pull-based, WIP Limiting systems. Scrum uses, in many senses, a kanban system at the heart of how they manage work. The Scrum team PULLS only the work they can manage into the iteration. The iteration planned work is the maximum amount of Work In Progress (WIP) that the Scrum team will be expected to deal with. The limit of the amount of work in the iteration is set by the team’s previous velocity measurements. But then we will start to encounter the limitations of the Scrum work management system. Scrum teams can still start a lot of work and suffer from the inefficiencies of multi-tasking. Having a lot of work in progress (started) but not finished is a significant source of waste in our industry. Humans cannot multi-task, we context switch and we all know that context-switching is expensive. Scrum does not have specific guidance to limit multi-tasking within a team. (Note: Please correct me if I’m wrong here. Haven’t read the Scrum Guide recently)
In a Kanban Method implementation, the focus is to limit WIP at a more granular level. Preferably at the work item level but we can also let the most appropriate granularity emerge by leveraging the learning aspects of the method. We use WIP limits to guide our intent to finish work before we start more work. We also use WIP limits to reduce overburdening. WIP limits are a great way to fine-tune your Kanban system and how and what to set them to would require a lot of explanation. Suffice to say that Kanban’s WIP limiting tactics allow for significantly more tuning that Scrum’s Sprint Planning tactic.
Work Items
Scrum teams tend to categorize work into two types, User Stories and Bugs. Both can be decomposed into tasks. Scrum actually provides guidance that there are “product backlog items” and that User Stories and Bugs may be types within that backlog. Additionally, Scrum allows work items to be of the same type but vary in size. This size is often described in Story Points. So one User Story may be 3 points, another may be 13 points. And there is no common interpretation of a point between different Scrum teams. What a story point actually means is specific to a Scrum team.
Kanban Method teams tend to have numerous types of work. Requirements, User Stories, Use Cases, Bugs, Defects, Improvement Activities are all examples of work items I’ve seen on Kanban boards. Whatever makes the most sense for the organization. Kanban differs from Scrum in that it generally does not try to categorize work by a size. The size of the work items in a Kanban system don’t really matter from a management and monitoring perspective. Once the item has been committed to by the Kanban team, they should finish it within the expected timeframe given how big they think it is when starting. It is when it starts to exceed expectations that the Kanban team should start to pay closer attention to it and take corrective actions if possible. But other than setting an expectation when the work is committed to, sizing isn’t important from a work management point of view. It should be noted though that smaller work items are usually easy to manage from a development point of view because the larger a work item is, the more likely that item is to contain significant unknowns and lots of uncertainty.
Metrics
Both Scrum and Kanban use metrics to help drive behaviour and decision making.
There is really only one metric in Scrum. Velocity. Teams will assign a estimated value to a work item that is used to indicated how “big” it is. The team will work as many items as they can in a sprint. Once the sprint is completed, the values of all completed work items will be summed up and that was the teams velocity for the sprint. This velocity will be used to determine how much work is pulled into the next sprint during sprint planning. You can create burn-down or burn-up charts based on the velocity metric as well. Typically, this is as scientific as a Scrum team will get. The summing of a subjective measure of size on a work item.
In The Kanban Method, all measurements are intended to be quantitative. Something that is measured and the value is (usually) not really debatable. In Kanban, we tend to measure time (lead/cycle) and quantities of things (work items) at various points in the workflow. These are all concrete, measurable attributes of work in the system. All that is needed is start and end-points and you can now start the clock when work gets into a state and then leaves the state. This can be as simple as started and finished or much more complicated with numerous states and parallel activities steams within a workflow. We also measure how many of something are in a particular state as well at a time as well. Ultimately in Kanban, we measure how long it took something to get somewhere. With these measures, we can determine rates, quantities, and speeds of work items and establish a deeper and more meaningful understanding of the system.
Differences
Workflow
Generally speaking, Scrum prescribes a set of activities that are performed within a Sprint. There is not any guidance on particular daily development activities but generally you should be analyzing, developing, testing, user acceptance testing throughout each day as applicable. But most Scrum teams will always do Sprint Planning, Development for the rest of the sprint, Iteration Review and Retrospective.
The Kanban Method does not prescribe any workflow. The workflow that you model in your Kanban system should be YOUR WORKFLOW, and it should evolve as required based on things that are observed and needed by the organization. A kanban system is expected to evolve and change over time as the organization (and it’s needs) change over time.
This also includes cadences. Scrum generally prescribes that the workflow happens within a cadence. Kanban does not prescribe cadences. It does appreciate the value of cadences but feels they should emerge where needed and the interval should be as long as needed, but Just-In-Time as much as possible.
Roles
Kanban does not prescribe any roles. Roles and responsibilities (and changes in them) should emerge based on the organizational maturity and understanding of the development process.
Scrum generally prescribes three roles, Scrum Master, Product Owner, and Team Member. If you’re on a Scrum team, you’re normally categorized as one of these things. I think that this can be a good thing, but it can also backfire as people try to find their place on the team. The individual esteem system of a person is influenced by what they think their place in the world is. Changing that place in the world can shake a person’s esteem and confidence, which tends to diminish their acceptance of a system or change.
System Thinking
Most people’s interpretation of Scrum is team-centric. This isn’t a necessarily a bad thing, but at some point it may become a limiting way of thinking when trying to scale Scrum or work with upstream and downstream partners of the Scrum team.
The Kanban Method takes a system thinking approach to process problems and expects the impact of changes to ripple throughout the entire workflow of the organization as business need/idea goes from inception (idea) to realization (software). Generally speaking, the kanban system is intended to protect the “work” (and therefore the team) from being disrupted so we don’t have to have a team-centric view of things. We can take a system thinking view of things and understand that every interface to our “team” system is actually an interface with a larger system that could benefit from The Kanban Method implementation.
Final Thoughts
This post has been much longer than I expected and I’m not sure I’m even done, but I think I’ve covered off what I think are the similarities and difference between Scrum and Kanban.
What I want to leave you with though is that neither approach is wrong, nor do they need to be exclusive of each other. There are teams that have started with Scrum and arrived at a Kanban Method implementation, and there are Kanban Method teams that have arrived at a very Scrum like (or Scrum exactly) implementation because that set of tactics and tools were the best way to manage work for that organization. It should never be a Scrum vs. Kanban conversation, but rather a question of what is the best from both methodologies that I could use.
I believe there are aspects of The Kanban Method that Scrum doesn’t adequately address in our quest to better manage knowledge work workflows, so I do think that while you can always have a system with “No Scrum”, you should never have a system with “No Kanban Method” in it.
Thanks for following along on this rather epic article. I hope to hear from you, both positive and negative comments are welcomed.
Intro to Kanban at the Calgary .NET User Group’s Lunch Series
I recently had the privilege to speak that the Calgary .NET User Group’s new lunchtime series. This series is an opportunity for people to come and hear about exciting new topics with a minimal time commitment. And in this case, CNUG President Dave Paquette felt is was about time that we have a talk about Kanban.
Here is a link to the video of my 50+ minute presentation. It’s the first time they’ve video taped one of these, so please don’t be to critical of the quality. 😀
You can find the slides on Slideshare here.
The one thing I’d like to pull out specifically from this presentation was the exercise we went through (11:24 in the video) in understanding what it was we were actually talking about. In my slide deck, I indicated there are three common definitions of kanban out there and that we really needed to understand which one we were talking about in any conversation around the topic. And in an informal little survey of what participants though kanban was, we got the all three definitions from different people in the audience. The three commonly confused definitions are:
- kanban – signboard, visual signal, card
- kanban system – pull-based work(flow) management system, normally at the heart of a kanban method implementation
- Kanban method – An approach to incremental, evolutionary process change for organizations
Very often when I am discussing the Kanban Method with people who are new to any of these ideas, they are often getting them confused and it is really important that we clarify which we are talking about.
Do you know what Kanban you’re talking about? 😀
Kanban Maturity and A Technique for Visualizing It
I received a great question from one of my webinar attendees and this question has also received a bunch of attention from the Kanban community since this visualization first surfaced in the summer of 2012 ago at the Kanban Leadership Retreat in Austria.
How do we measure our maturity using the Kanban method?
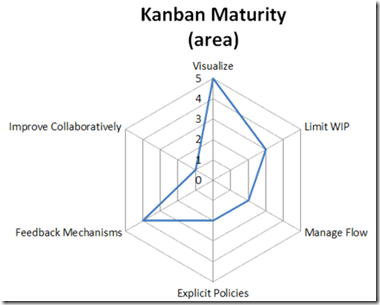
I have used the technique that came out of Mayrhofen at #KLRAT as the basis for how I work with teams to monitor Kanban maturity. There isn’t a “standard” set of questions that the Kanban community uses in the creation of the kiveat chart. In general, it is being suggested that each team/coach comes up with a context-specific way of measuring and ranking maturity within the 6 practice groups that applies to “that team”. That visualization can then be used to monitor the anticipated growth for that team over the course of time. One thing that the Kanban community is cautious about though is “comparisons” between kiveat charts and assessments. Since each assessment is relatively subjective, comparisons should be avoided as it would be hard to compare and may potentially be misleading to the team.
That said, here is how I use the chart.
I have a set of questions I ask per category. On a scale of 1 to 5, 1 being “We do not do that”, 3 being “We do that”, 5 being “We could teach someone to do that”, I look for activities that would allow me to select one of those values for one of my questions. As an example:
Question: Identifying types of work
Observation: Does the team identify different types of work? Do they have User Stories, Bugs, Improvement Tasks, etc. described within their process? If they do not, they would be a 1. If they do, they would be a 3. I’d then look for evidence that they are capable of teaching work item type defining to another team, or that they could do so if required. If they could, they would be a 5.
I go through all of my questions for an axis of the chart and give them these rankings. I then take the average value of all of the answers and that is my data point on the kiveat chart. My visualization category currently has 10 questions in it, so if I get 35 total points/10 questions, I get a 3.5 visualization score on the kiveat chart.
My Limit WIP category currently has 5 questions, so 15 points/5 questions would give me a 3 Limit WIP ranking on the chart.
Following this pattern, I eventually end up with 6 axis on the kiveat chart, all ranked from 1 to 5 and this “coverage” can be used to describe the team’s Kanban maturity from my perspective.
David Anderson, in some of the slides I’ve seen him use and in talking to him, describes a progression of novice to experienced tactics within each category and each of his axis has different scales to represent the increasing maturity on that scale. He does arrive at the same kind of coverage visual and describes that coverage as an indicator of maturity from his perspective. My kiveat chart and David’s would not be comparable though and this is completely OK and encouraged. As I mentioned above, the current thoughts within the Kanban community are to discourage direct comparisons between these kiveat charts.
What kinds of questions would you use to measure you’re companies Kanban maturity?
What Should My WIP Limit Be? Super Easy Method to Find Out!
If you’ve built a kanban system, or you’ve tried to put a WIP (work in progress) limit on a phase in your workflow, you’ve probably asked or been asked this question. And very often, then answer is “I don’t know. How about we try n.” where n is a guess. Usually an educated guess like:
- 2 x the number of developers
- 1.5 x the number of people on the team
- Number of people involved + 1
And these are all ok places to start if you have no data, but with a little data, we can stop guessing and set our WIP limits with some empirical information and at the same time start building a system that will satisfy one of the assumptions required for us to use Little’s Law properly. There are two things that we need to have in order to use this super easy method:
- Data about average time in state for work items
- CFD (cumulative flow diagram)
Ok, I guess we don’t need the CFD if we have the data, but it sure is nice to visualize this information. 😉 We do need to have some data about the way that work passes through our system and we need the data that would be required to create a CFD. For the purposes of this post, lets assume that we are capture the time in state for each work item. Entire time in the system is often called lead time. Time in between any two phases in the system can be cycle time but we’re interested in cycle times for a single state at a time as our objective is to determine the WIP limits for each column in our kanban system.
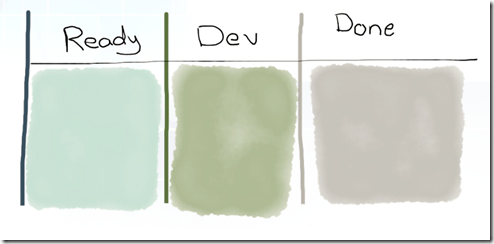
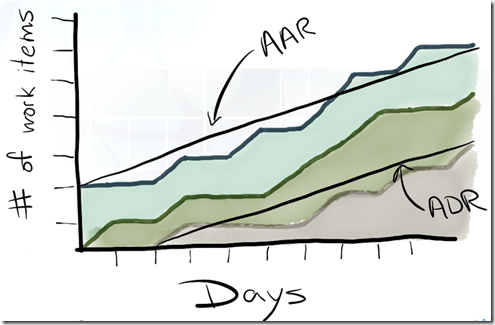
Let’s use a simple approach to measuring average time in state in days. On our simple kanban system above, we have a Ready State, Development state and a Done state. Each day, we count the # of items that have cross a state boundary and put those numbers on our CFD chart. After several weeks, we have enough data to start calculating a couple new metrics from our CFD.
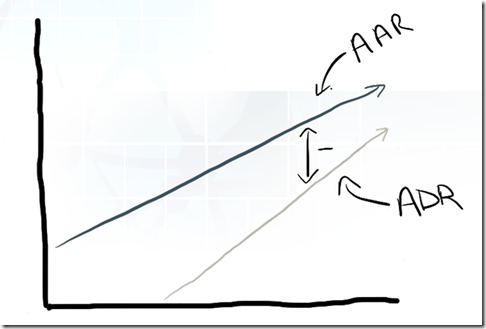
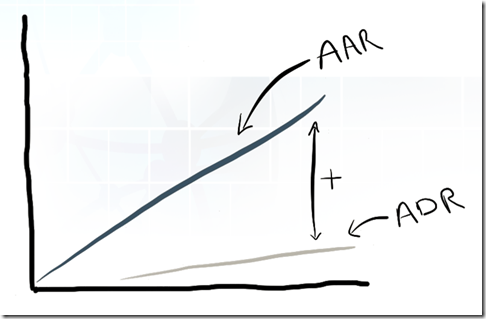
With even just a couple weeks of data that visualizes how work moves through our system, we can now start measuring Average Arrival Rate (AAR) and Average Departure Rate (ADR) between any two states in our system. AAR and ADR are simply represented as the slope of a line. If we calculate the rise (x-axis) over the run (y-axis) values, we get the slope.
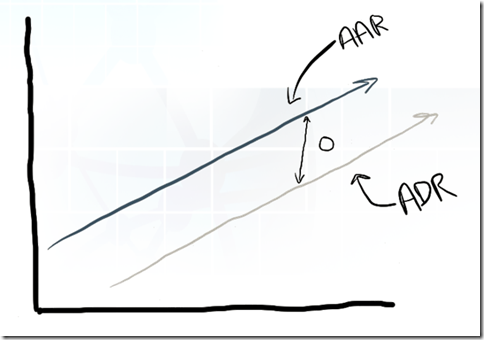
It is the relationship between the two values that is interesting to us and will allow us to more empirically set the WIP Limit values in the system. Based on our understanding of Little’s Law, we are striving for a average rate of divergence between the two of near 0.
A negative divergence suggests the WIP limit is to low and that we are under utilized.
A positive divergence rate suggests the WIP is too high and we are overburdened.
Since ADR (the rate at which we finish work) represents our current capability, the value of ADR should be considered a great candidate for the WIP limit for this state. With the the right WIP limit in place, AAR should match ADR and we will find an average divergence rate of 0. As your team’s capability changes, our divergence will go either positive or negative and will provide an indication of when our WIP limits should change and what they should change to.
And there you have it! When the rate of divergence between AAR and ADR is near zero, we know that our WIP limit is right and that we’re satisfying one of the assumptions required to make Little’s Law work for us!
ALM Adoption Success Story – Success Factor 2 – Visualize Your Work
Humans love pictures.
We have numerous sayings in our cultures about how powerful visualizations are.
“A picture is worth a thousand words“
“The drawing shows me at one glance what might be spread over ten pages in a book.”
“Every picture tells a story.”
One that the challenges with knowledge work is that for the most part, most of our work is invisible until it’s done. Only Neo can see bits and bytes which leaves the rest of us a little in the dark. If you’re building a building, or digging a hole in the ground, progress is obvious! For invisible work, progress is very difficult to monitor.
So we track work in some software system, but then we hide all of our knowledge in text and numbers! Our love of spreadsheets is epic in proportion. Status reports! MS Project files! All of this data!! For all intents and purposes, our work is still invisible! We often mistake this data for knowledge and understanding and the true insights are left hidden in the numbers.
On our project, we knew it would be very important to understand at a glance where we were in our workflow. We were doing something very novel for this organization and in order to mitigate the risk of heading too far in the wrong direction (which could be any direction at this point), we needed knowledge. We needed to quickly identify roadblocks to progress, which often included self-inflicted delays. We needed to engage with our sponsor in a meaningful manner.
So we started drawing pictures!
The most important “picture” that we have used has been our storyboard. This board is very important to us. It is a muster point for our daily stand-up meetings. It is a place on which to hang “adornments” that help us quickly assess our current state. It is a tool that promotes conversations. And it is always there, silently reminding us to be disciplined with efforts to visualize our work.
Our storyboard looks like pretty much like any other Agile teams storyboard in form, but this one is a unique work of art. Well, unique in that it is exactly what we need it to be at the moment. It represents our workflow. We have our WIP limits on it. And because we are fairly disciplined in maintaining the current state of all our work, it’s always up to date.
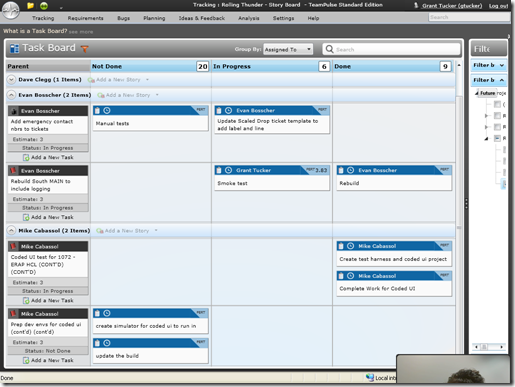
We also visualize our tasks and review these daily as well. TeamPulse has a story board as well as a task board for more granular visualizations.
We don’t have WIP limits enabled on the tasks boards, but again, the intent is to see work flowing through the system. And with an explicit policy that tasks should have a cycle time of 1 day, any time an item is discussed at 2 stand-up meetings, the team knows that the work isn’t progressing as expected and some sort of investigation and corrective action may need to take place.
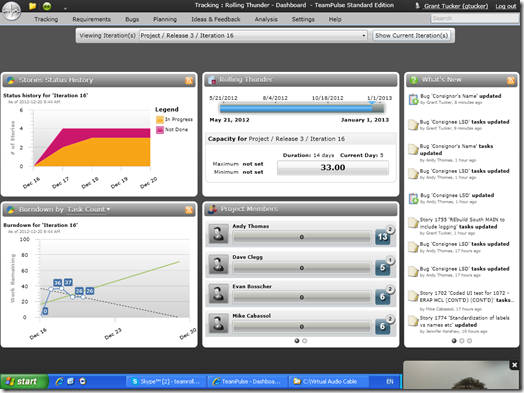
Finally, we use TeamPulse dashboards to visualize our progress over the course of an iteration.
Everyday, we review the storyboards and the tasks boards during our stand-up, and then we review the dashboards to bring the entire conversation back to our progress versus our (the team’s) expectations for the iteration. These dashboards provide that high-level perspective that ties everything back together.
And all of this information is available on the web, to everyone on the project team, including the sponsor. There is no need to interpret numbers. There isn’t a report that needs to be compiled. And the information we want to present is immediately available in a very easy to consume and impactful format because a picture is worth a thousand words!
Going back to the first ALM Adoption Success Factor of Transparency, having something to be transparent with has been a key enabler of success for our team as we strive to deliver this project and continuously improve and get better as we do it.
Series List
- Success Factor 1 – Transparency
- Success Factor 2 – Visualize Your Work
- Coming soon – Success Factor 3 – Co-location
- Coming soon – Success Factor 4 – Invest In Your Tools
- Coming soon – Success Factor 5 – Retrospectives
Little’s Law – It’s not about the numbers
I was recently at the Kanban Leadership Retreat in San Diego, hanging out with a bunch of great people from the community and talking all about Kanban for three days.
This is an un-conference format event so we end up talking about whatever the group is interested in talking about, and one of the best sessions that we had (amongst a group of great sessions) was a session on Little’s Law that was hosted by Dan Vacanti (@danvacanti). Dan has been talking about Little’s Law at conferences for the last few months and the group was really interested in hearing this presentation as well as the interactive questions and answer that would happen throughout. It was during the interactive part of the session that “it” finally clicked for me!
Up until now, I didn’t understand why I would need to use Little’s law. I don’t want to use this blog post to describe Little’s Law and besides, Daniel’s presentation does an excellent job of that.
I’m really dumbing this down but in short (Sorry Dan), Little’s Law provides two things of interest for us Kanban practitioners:
1. allows us to derive one of three important Kanban metrics when any two of them are available to use in the calculation
2. allows us to understand/predict the impact of changes on one of those values to the other two
On the first point, for people running their work in kanban systems, normally all of the values are available if you’re managing your work well enough. Approx. Avg. Lead-time, Avg. Work In Progress, Avg. Throughput are relatively easily tracked or counted, and they can all be seen in a Cumulative Flow Diagram. Given I can observe all three in our system; I don’t need Little’s Law to help with that.
Note* – For planning purposes, we can use this relationship to understand what numbers
we might need in the future. Eg. Calculating required WIP based on an anticipated throughput and a proven capability (lead time) to establish resourcing levels
The second point is really interesting to us but is also where we stumble upon the gotcha and the false knowledge that often occurs on teams when they are using Little’s Law. It was in the interactive session that I finally had my epiphany around this second point! It isn’t (usually) about calculating the missing number or predicting changes in the numbers. It is about ensuring that you CAN use Little’s Law at all!! That’s the tricky part and in my opinion, the really powerful thing I learned at KLRUS.
See, in order to use Little’s Law and have it work as you’d expect, there are a number of really important assumptions that have to be true before you can use Little’s Law and it is in making these assumptions true in our kanban systems that we achieve the true benefit!
The assumptions are (for the period of time that is under observation):
- All measurement units are consistent
- Conservation of Flow which assumes
- Average Arrival Rate == Average Departure Rate
- All work that enters the system flows through to completion and exits
- System is “stable”
- The average age of WIP is neither increasing or decreasing
- The total amount of WIP is roughly the same at the beginning and at the end
All Measurement Units are Consistent
This one is relatively easy. If you’re measuring in weeks for Throughput, your Lead time should be in weeks. If your WIP is a User Story, your throughput is in User Story. We can’t have WIP as User story and Throughput as Tasks. We can’t have Throughput as User Story/week and Lead Time as User Story/day.
Average Arrival Rate (AAR) == Average Departure Rate (ADR)
This one is a bit trickier, but not too bad. One of the assumptions required, as described by Dr. Little, is Conservation of Flow and this metric is one of the ways that we measure this in Kanban. And the tactic we use to manipulate this situation is our WIP limits. If we only accept new work into our system at the same rate that work leaves our system, we are stable enough for Little’s Law to work.
All Work That Enters the System Leaves the System
Work that enters our system and doesn’t exit in a predictable fashion will disrupt the Conservation of Flow. AAR and ADR can’t be equal if this happens frequently in the system. We do have to watch out for work being “created” within the system that could mask abnormal termination of work within the system.
Average Age of WIP is Constant
Little’s Law also requires a “Stable System”, which I’m not going to explore deeply in this article. One of the two metrics that we can use from our kanban system though to determine if our system is stable is the average age of WIP in the system. Over the period of time being observed, we want this average to be constant.
Total WIP at Beginning and End of Time Period are the Same
The second metric we use to determine system stability is WIP totals at the beginning and end of the time period under observation. If our WIP is trending up or down, we do not have a stable system and predictions that we get from Little’s Law will be suspect.
So what does this all mean…
So we have a law that we want to use, but in order to use it, we have to fulfill the required assumptions for the law to work. The required assumptions are going to cause us to create specific and explicit policies that will describe how our teams behave. The effects of these policies are varied, but you will see improvements in prioritization and pulling of work, queuing, swarming, workflow/system design, and WIP limits just to name a few in order to effectively strive to satisfy the assumptions.
In Conclusion
The power of Little’s Law to Kanban teams is not its ability to predict WIP, Thoughput or Leadtime. The true power lies in its ability to influence team behavior with its underlying assumptions.
When Little’s Law is properly understood by Kanban teams, it will encourage those teams to strive to satisfy the Law’s assumptions which will result in improved predictability and a kanban system that can be “tweaked” to achieve whatever goal is required at the time.
Kanban Has Changed The Way I Think (or Creating Business Value out of Creative Queue Uses)
Queues are all around us. Policies are everywhere.
Can we use the two together in a simple fashion to create business value?
Note* – Once you get really interested in Kanban, these are the kinds of observations and questions
that just randomly pop into your head, so beware. 😀
I was sitting on a plane and luckily had a window seat and I was watching the baggage handlers loading the luggage onto the plane. They were counting the bags and starting to load them onto the plane and I looked away for a bit. After a few minutes, I looked back and notice they were almost done and that is when I noticed the priority baggage tag on the last bags being loaded. This is where kanban took over my brain.
Could a simple policy that was implemented by baggage handlers and a Last In – First Out (LIFO) queuing technique manage the priority baggage solution? It seemed to me that this would be a simple tactic to provide a value-add service to customers that they might pay for.
I’m sure it would be a little bit more involved than that (bag check tagging bags, people loading the conveyer belts that take luggage the last mile would need to use a FIFO approach) but basically with a simple policy change (it would have to be an explicit policy) and an understanding of how queues work, the airlines have created business value out of thin air!
Are there any simple policies or queues that you could use to create business value for your organization?
Thought-leaders – “Centers of Gravity” for Knowledge and Learning
I’m a consultant. I’ve been very fortunate to fall into this line of work and I really love what I do.
One of the hard parts of being a consultant though is “staying ahead of the curve”. A consultant is only as good as the skills he possesses and our industry is constantly (and successfully) striving to make our current knowledge and skillset obsolete.
So I do the things that most consultants do. I practice what I know and try new things. I read books. I surf the web. I have my favorite blogs. I use twitter lists to follow people who are aligned with particular interests of mine. And this has been a good tactic for keeping up.
At some point though, I started going to conferences and this is when my growth as a practitioner in my profession started to go to the next level.
I remember the first time I saw a industry luminary, Don Box. At the time, he was really ramping up SOAP, XML, Messaging, all that goodness of the early 2000s. The content of his talk was all available on the web or in books but that wasn’t what I really got from his presentation. In hindsight I’ve realized the true value I took from that experience was his passion for the topics and his stories! I came back from that conference pumped about those technologies and finding exciting new ways to use them! And boy is XML, SOAP and messaging exciting!! <smirk>
Fast forward a bit and now I’m a consultant who is trying to be better at helping individuals, teams and organizations be better and I’m doing this at an amazing time in our industry. Agile is going full steam ahead. Lean and Kanban are entering the process space and starting to make significant inroads. There is a lot to learn and discover, validate or refute. And this is where the thought-leaders come in.
This might sounds obvious, but thought-leaders are really interested in the things they are leading in! They are deeply interested in why “it” works or how they can apply “it” to a new problem. They want to break or validate their thoughts or have them refuted because they are passionate about making “it” better. It’s been my observation that they aren’t normally as interested in applying their specific knowledge to someone else’s problem like most of the rest of us.
It is this unique environment that thought-leaders create around themselves that presents an amazing learning opportunity to the rest of us.
Let me use an example that is fresh in my mind. I’m really interested in The Kanban Method. I think it has the potential to change the way that we all work. But there is a lot to learn and I also want to make sure I’m challenging the method and myself continuously. Enter David Anderson, Kanban thought-leader.
Now David is a really smart guy and he is passionate about his art. He’s a “center of gravity” in the Kanban universe right now. And the really cool thing about that is the attraction of all things Kanban, good and bad, to that center of gravity. If you put yourself in proximity to that center of gravity, virtually or physically, you will be exposed to so many ideas, good and bad, about Kanban. You’re also going to be exposed to the passion to evangelize and grow that David brings to the community.
When I became interested in Kanban I:
- Attended a leadership course with David
- Attended LSSC12 in Boston and Kanban Leadership Retreat in San Diego
- Started following a lot of people in the Kanban community on twitter, finding them because many of them followed David
- Started following blogs of people in the Kanban community, many found from being in the mix with that community
- Got involved in leading-edge questions and challenges with the method, many of which are being discussed by David
I had the same experience with Scrum. My perspective on Scrum was completely opened up by spending a couple days in a course with Ken Schwaber. His perspective on Scrum was so different than anyone else’s, he is very passionate about Scrum and it was such a great learning experience. I also started following @Scrumdotorg on twitter and recognized the value in finding an anchor within that community!
I had the same experience technically with CQRS, an application architectural design pattern. When I became interested in that, I started following thought-leaders in that space.
All of the “technologies” that we use have these centers of gravity that attract all of the good and bad. And there is so much learning to be gained from being in these environments!
So it’s my challenge to you today to go and find a center of gravity in a technology you are really interested in. Find a thought-leader on twitter or find their blog. Find a conference that they will be speaking at and attend. Ask them a question, or ask the community around them a question! Get involved with the communities that are swirling around these thought-leaders and take full advantage of the learning opportunities that will present themselves!

